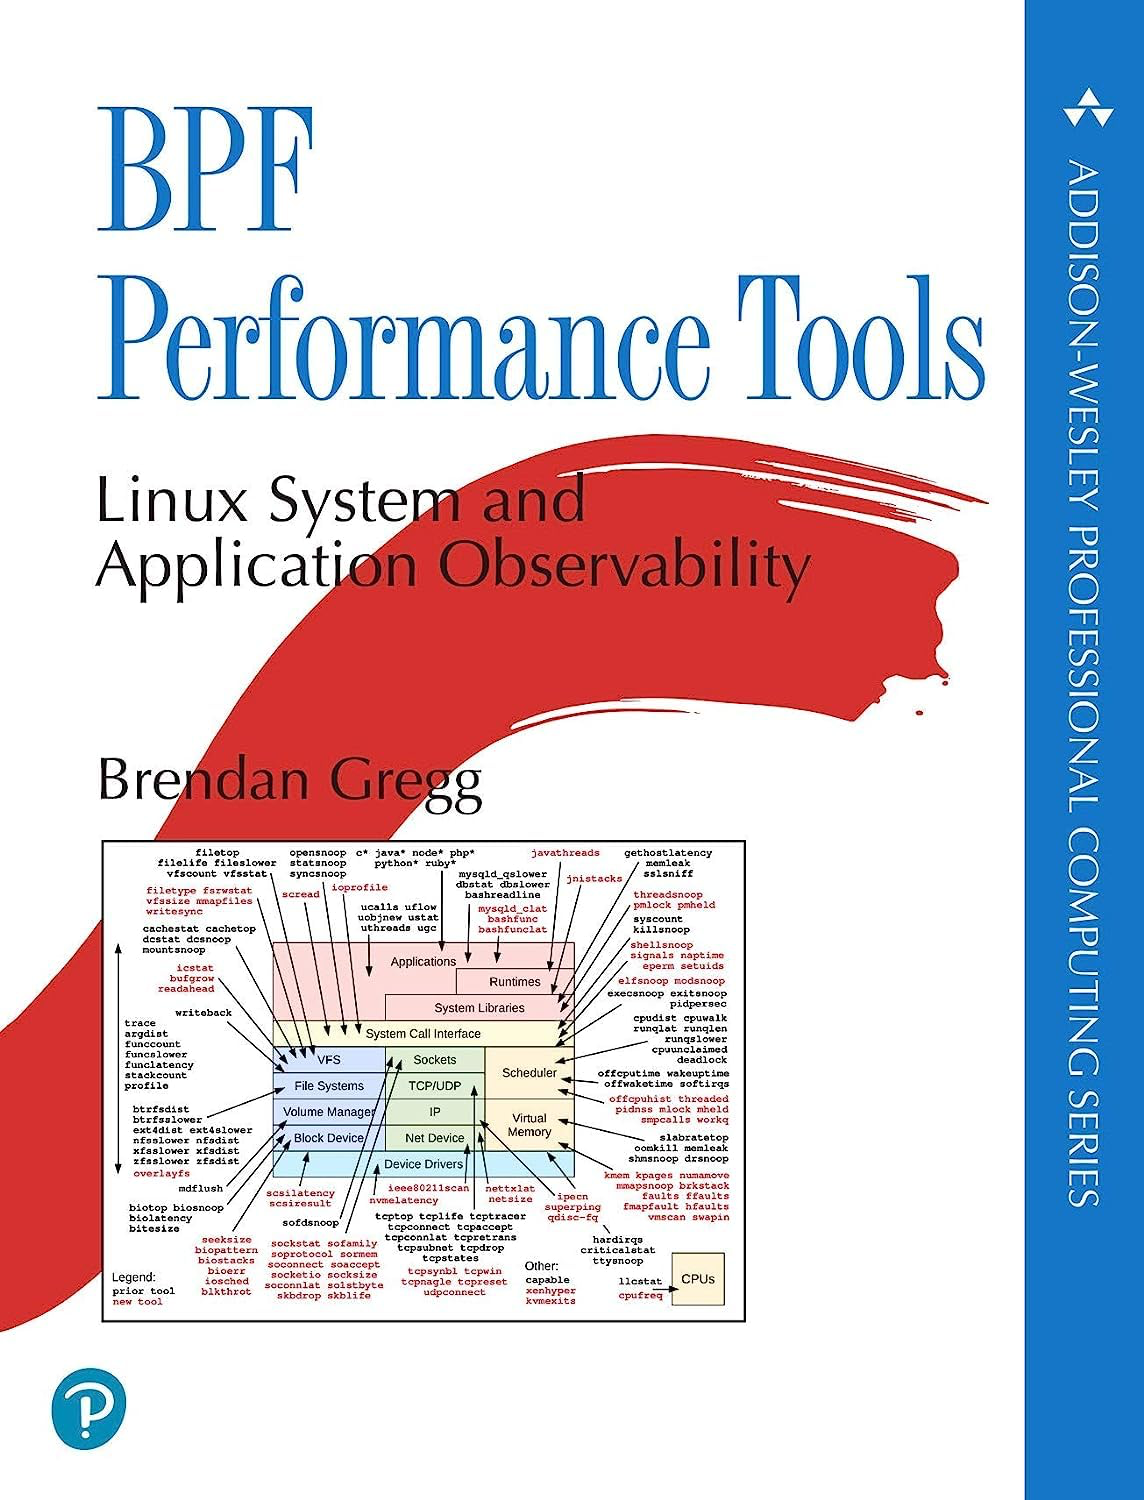
Brendan Gregg formerly of NetFlix has contributed significantly to the world of observability and uses his experience in troubleshooting and tracing some of the most interesting problems any of us are likely to come across.
So what is BPF? Those of us in the Unix, Linux, and BSD world will likely say Berkley packet filters, and to be fair, this was the case. BPF was originally created to allow users to create filters for TCPDump to monitor selected network traffic and either send this to a PCAP, or display on the screen. This was useful when troubleshooting what was happening on the “wire” as opposed to what people think is going over the wire. I’ve used this to troubleshoot everything from port security, voice over IP issues, to performance analysis. The phrase “PCAP, or it didn’t happen” exists for a reason.

BPF has moved away from being just an acronym to the name of a feature sometimes referred to as eBPF (extended BPF) which now allows us to virtually trace anything that happens inside the Linux kernel. This could be performance related, security related, or even modifying the behaviour of the kernel altogether. Load balancers and firewalls have been created in BPF. I’ve even started building a congestion control algorithm leveraging BPF. The possibilities here are endless, you can now write kernel safe code to be run in the kernel with information being fed up to user-land through maps.
This book however focuses on the performance aspects of BPF using Tracing. The difference between tracing and logs is the ability to trace events in real time without relying on pre-existing logs that occur without context. I could for example trace every socket accept event from every application and process on my machine, or trace server response times, or the amount of time spent in a particular state.
What I particularly liked was how the author broke down performance into specific domains including disk io, network io, applications and showed us real examples of BPF in action via BCC (BPF Compiler Collection) and also using the BPF APIs. There were one liners on practically every aspect of Linux performance I would want to query.
Perhaps most importantly the author compared and contrasted traditional tools we would use with the BCC approach in one line! This has completely changed the way I plan to approach performance troubleshooting in Linux.
If you made it this far, thanks for reading.

Leave a Reply